Real GSC screenshots, what flopped, why our CTR is embarrassing, and the content math we'd use if starting over.
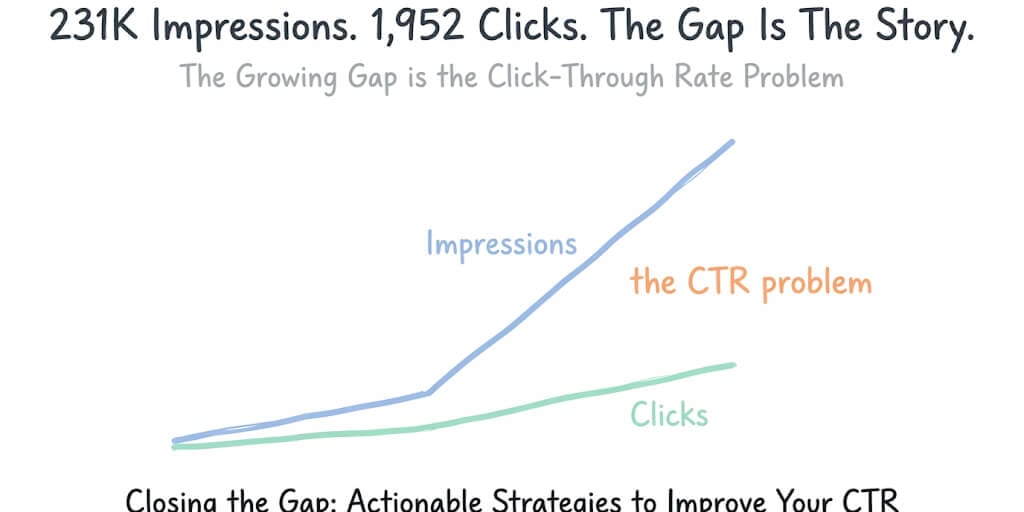
I'm staring at our Google Search Console dashboard. The impressions chart looks incredible. Classic hockey stick, bottom-left to top-right, the kind of graph you screenshot and post on X with a fire emoji.
Then I look at the clicks chart directly below it and the fire emoji dies in my throat.
231,000 weekly impressions. 1,952 weekly clicks. That's a 0.84% click-through rate. For SaaS in content-heavy niches, organic CTR typically runs between 3 and 7 percent, which means we're converting less than a quarter of what a healthy page should.
Here's the uncomfortable thing about publishing this. Most "how we grew" posts cherry-pick the flattering number. The flattering number here is 231K impressions, up from basically nothing ten weeks ago, with zero dollars spent on ads and a team of two. The honest number is 0.84%. And the honest number is the one that actually teaches you something.
So here's the whole story. What we published, what worked, what flopped hard, what we'd do differently, and the specific content math behind all of it. With real numbers where we have them and honest uncertainty where we don't.
The raw timeline, week by week
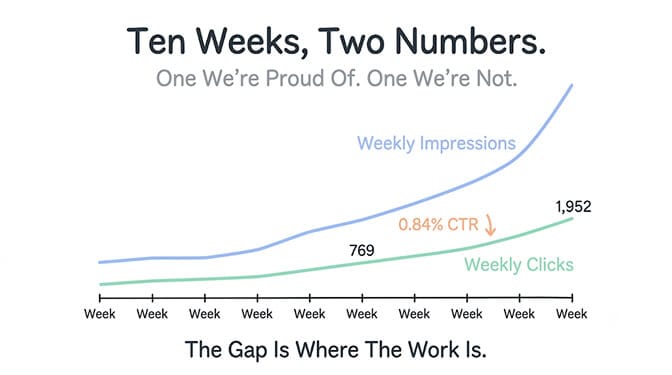
Weeks 1 through 3: Basically a flat line. A trickle of impressions on a handful of pages, most of them branded searches from people who already knew about us. Nothing to post about. Nothing to learn from yet either.
Weeks 4 through 6: Something shifted, but it was subtle. Impressions started climbing on pages we hadn't touched in weeks. Not a single post spiking. More like the whole domain warming up. In retrospect, this is when Google started trusting us as a source on a narrow set of topics, not because any individual post was special, but because we'd published enough related content that topical authority started compounding.
Weeks 7 through 10: The climb got steep. 231,000 weekly impressions by the end. But the clicks didn't keep pace. The gap between the two lines on the chart kept widening, which meant Google was willing to show our pages to more people, but the people seeing them weren't clicking through.
Total content published across this period: 113 posts. Two people. Nights and weekends. No freelancers, no agency, no AI-generated content dumps. Average time per post: roughly 2 to 3 hours including research, writing, image prompts, and internal linking. Total cash spent on content creation and distribution: $0. Hosting and domain costs existed but aren't meaningful to the content story.
The impressive number (231K impressions) and the embarrassing number (0.84% CTR) happened at the same time, caused by the same content. That's the part most growth stories leave out.
What actually drove the growth
We published 113 posts. Maybe 20 of them drove the majority of measurable results. Here's what those 20 had in common and what the other 93 were missing.
Narrow comparisons outperformed everything else
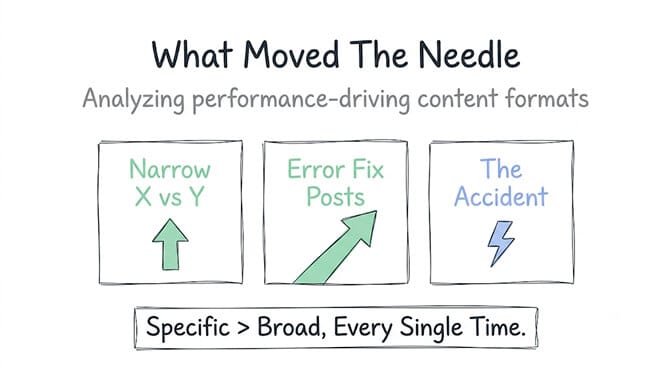
Not "best AI agent builders 2026" style roundups that name eight tools and say nothing specific about any of them. The comparisons that worked were this tool versus that tool, answering a question someone was actually typing into Google at 11 PM while trying to make a decision.
The pattern: the narrower the comparison, the better it performed. "X vs Y" beat "X vs Y vs Z" which beat "best tools for category" almost without exception. Specificity earned both the ranking and the click. (This very post's siblings are the pattern in action: Pydantic AI vs LangChain and MiniMax M3 vs Claude Opus 4.6 are one-vs-one by design.)
Why this works, mechanically: narrow comparisons target queries where the searcher has already narrowed their own options. They're not browsing. They're choosing. That intent gap between "what tools exist" and "which of these two should I pick" is enormous, and it shows up directly in CTR and time-on-page.
Error fix posts were the highest-intent traffic by a wide margin
Someone searching an exact error message has a problem right now. They're not browsing. They're not comparing. They need one page to solve one thing. If your page actually solves it, they read the whole thing, and a meaningful share of them explore what else you've written.
We published fix guides for specific Hermes Agent errors, truncation issues, and memory configuration problems. These weren't glamorous posts. They were the kind of thing you write because you hit the same error yourself and your fix worked. But the search intent behind "hermes agent error code 400 fix" is closer to 100% click-through intent than almost any other query type we found.
Then there was the accident
We published a post about NVIDIA DGX Spark memory bandwidth almost as a side note. A technical question came up during research for a completely different piece, and we couldn't find a clear answer online, so we wrote one.
It wasn't a strategic content bet. We didn't research the keyword volume beforehand. It just happened to answer a question a specific, underserved audience was actively asking, at a moment when almost nobody else had answered it clearly.
That post pulled steady, compounding traffic for weeks. Not viral. Just... consistently useful to people with a specific question.
The lesson wasn't "write more hardware content." It was this: when you notice yourself needing to research something to answer your own question, that's often a signal other people are stuck on the same thing. The gap between "I needed to look this up" and "nobody has written this clearly yet" is where the best unplanned content lives.
What flopped, and we spent real time on these
This is the section most growth posts skip, and it's the section that's actually most useful if you're building your own content operation.
"Best of" roundups underperformed almost everything
We wrote several "best AI agent builders in 2026" and "top alternatives to X" style roundups. They took the most research time. They read the most polished. They generated the least traffic per hour invested of anything we published.
The problem: a "best of" post is competing against hundreds of other pages saying almost the exact same thing, published by sites with years of accumulated authority. Google has no strong reason to pick yours over theirs, and readers can feel the interchangeability.
Generic explainers ("what is X") were the other consistent miss
"What is an AI agent" style content sounds like it should rank, because the topic feels foundational. In practice, foundational topics are the most contested ground in any niche. Writing the hundredth explainer on a topic that's been explained a hundred times doesn't help a smaller domain.
Here's the pattern underneath both failures: broad topics reward existing authority. Narrow topics reward being first and being specific. A two-person team competing on breadth is fighting a battle it loses by default. A two-person team competing on specificity has an actual shot.
We spent probably 30 to 40 hours across the ten weeks on roundups and generic explainers. That time would have been better spent on 15 more narrow comparisons and error fix posts. We can't get those hours back, but we can stop repeating the pattern.
The CTR problem nobody wants to talk about
This is the part we'd normally leave out of a post like this. We're including it because it's the most useful thing in the whole article for anyone else in a similar position.
231,000 impressions. 1,952 clicks. 0.84% CTR.
Here's what makes that number more complicated than it looks.
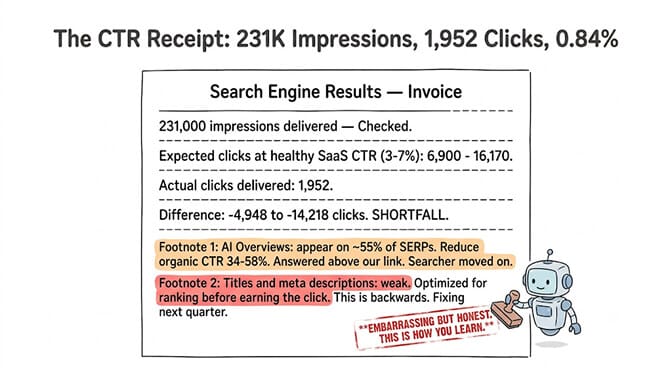
Zero-click searches now account for 58.5% of all Google searches in the US, according to SparkToro and Datos. AI Overviews appear on approximately 55% of all SERPs as of early 2026, and when they're present, organic CTR drops between 34.5 and 58 percent depending on query type and position.
That means some of our impressions are hitting SERPs where a click was never really available in the first place. The AI Overview answered the question above our link, and the searcher moved on.
But that doesn't explain all of it. For SaaS and content-heavy niches, even top-of-funnel informational queries should pull closer to 3 to 5 percent CTR, and our domain-wide number is well under that even accounting for zero-click erosion.
The real diagnosis: our titles and meta descriptions are weak. We optimized for ranking before we optimized for earning the click once shown. That's backwards, and it's exactly what we're spending the next quarter fixing.
We built BetterClaw because we kept running into this exact pattern across our own operations. Not just content, but everywhere: a metric climbs, the follow-through lags, and nobody notices until the gap gets embarrassing. An agent that checks your Search Console data every morning and flags exactly this kind of impressions-versus-clicks divergence is a genuinely useful thing to have running, and it's the kind of recurring diagnostic task the platform is built to make trivial to set up. Free plan, no credit card, one agent, 100 credits a month.
The specific content math we'd use if starting over
If we were doing this from scratch with the same two-person constraint and the same $0 budget, here's the allocation we'd use based on what the last ten weeks taught us:
- 60% of publishing hours on narrow comparisons. Tool X vs Tool Y, one versus one, targeting the specific query someone types when they've already narrowed their options. These are the posts where specificity is your advantage and domain authority matters least.
- 25% on error fix and troubleshooting posts. Exact error messages, exact fix steps. The highest-intent traffic you can earn, and the queries with the least competition because most companies don't want to publish content about things breaking.
- 10% on "accidental" posts. Questions you needed answered during your own work that nobody has written clearly about yet. You can't plan these, but you can create the habit of noticing them when they happen instead of just finding the answer and moving on.
- 5% on thought leadership and brand content. Not zero. Just last in line, and only after the other categories have earned enough search authority that Google trusts you on broader topics.
We would publish zero "best of" roundups. Not because they're inherently bad writing, but because they're the least efficient use of limited hours. Every hour a two-person team spends on a broad roundup is an hour not spent on a narrow comparison that would have outperformed it.
According to First Page Sage, SaaS companies that publish 8 or more topical cluster articles per pillar page average 2.3 times more non-branded sessions than those publishing fewer than 4. That's a fancy way of saying the same thing we learned from raw experience: a cluster of narrow, related posts built around one specific topic outperforms scattered broad posts every time.
What we're doing next
We're not chasing more impressions right now. We have enough of those to work with. The next ten weeks are about closing the CTR gap, which means rewriting titles and meta descriptions on the 30 pages that currently earn the most impressions per week.
We're also tracking our branded versus non-branded traffic split. For a healthy SaaS domain, the target split is roughly 20 to 25 percent branded and 75 to 80 percent non-branded, according to Semrush's 2026 benchmarks. We're not there yet, but the direction is right, and every percentage point of non-branded traffic is evidence that content, not just brand recognition, is earning its keep.
And we're going to keep publishing the boring, honest version of what's actually happening. Including the numbers that look bad. Because the sanitized version of a growth story is just a press release dressed up as a blog post, and press releases help nobody build anything real.
The honest bottom line
None of this happened because we discovered a trick. It happened because we published a lot of things that didn't work, paid close attention to the few things that did, and then did more of those while stopping the rest.
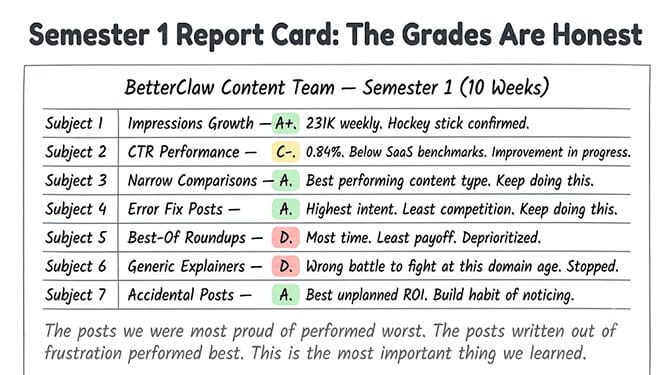
The posts we were most proud of writing were, almost without exception, the ones that performed worst. The posts we wrote out of frustration, because something broke and we needed to fix it for ourselves first, were the ones that actually took off.
That's BetterClaw. A no-code AI agent platform, built by the same two people who wrote all 113 of these posts and got most of them wrong before getting some of them right. If you want to see what a small team can ship without a dev team, a VC deck, or an ad budget, give BetterClaw a try. Free plan with one agent and 100 credits a month. $49 a month for Pro. Your first agent deploys in about 60 seconds. We handle the infrastructure. You handle the interesting part.
Or don't, and just use the content math above. That part's free regardless.
Frequently Asked Questions
How did BetterClaw grow its organic search traffic with no ad spend?
Growth came from a specific content strategy: narrow tool comparisons and error-fix guides published consistently by a two-person team over ten weeks, growing from 769 to 1,952 weekly clicks. Broad "best of" roundups and generic explainers underperformed and were eventually deprioritized.
How does this growth compare to typical SaaS content marketing?
The impressions growth (reaching 231K weekly) outpaced the industry norm for a domain this young, but the 0.84% CTR significantly trails the 3 to 7 percent range that healthy SaaS content pages typically achieve. The gap between impressions and clicks is the specific problem being addressed next.
How long does it take to see organic content growth for a SaaS blog?
In this case, the first 3 weeks showed minimal movement, with compounding growth becoming visible around week 4 and accelerating through week 10. The inflection wasn't from a single viral post but from accumulated topical authority across many related pages. 113 posts were published total, averaging 2 to 3 hours each.
Is 0.84% CTR good for a SaaS blog?
Not by historical standards. SaaS organic CTR benchmarks run 3 to 7 percent. However, the 2026 search environment has shifted significantly: AI Overviews now appear on roughly 55% of SERPs and reduce organic CTR by 34 to 58 percent, and zero-click searches account for 58.5% of all US Google searches. The number is still below target, but the target itself has moved.
Can a small team really compete on SEO without paid promotion?
Yes, but content choice matters more than consistency alone. Broad, competitive topics like generic overviews and roundups compete against sites with years of domain authority, while narrow, specific posts (especially one-vs-one comparisons and exact error fixes) find genuine underserved search demand a two-person team can actually win.