We had an agent handling email triage. It read new emails, classified urgency, drafted responses for low-priority items, and flagged high-priority ones for human review.
In testing, it was fast. Sub-two-second responses. We were thrilled.
In production, it took 15 seconds per email. Sometimes 20. Users started complaining within the first hour.
My first instinct: the model is too slow, let's switch to something faster. So we swapped Claude Sonnet for GPT-5 Nano. Barely any improvement. Maybe half a second shaved off.
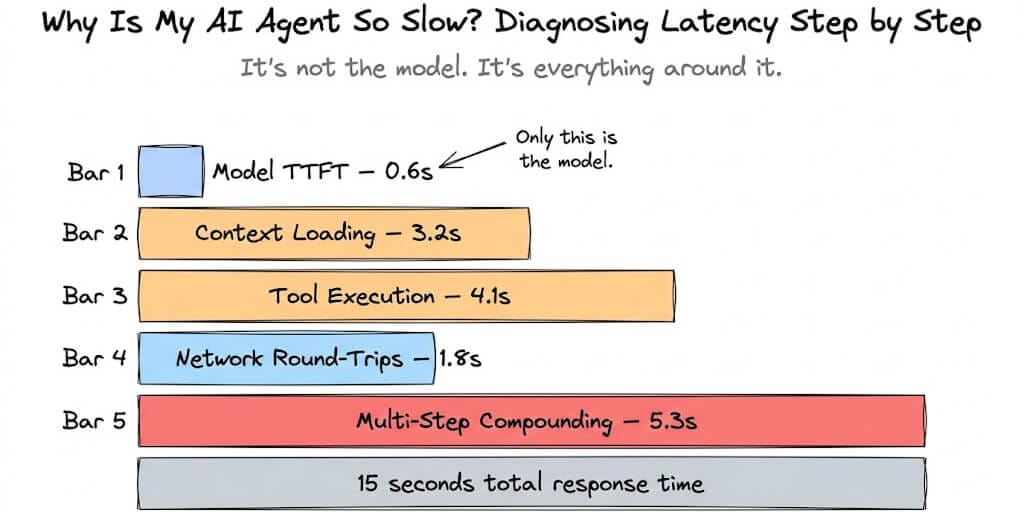
That's when it hit me. The model wasn't the bottleneck. The model was doing its job in under a second. Everything else around it was eating the other 14 seconds.
If your AI agent is slow, the model is almost never the real problem. The real problem lives in one of five places. Here's how to find it.
The five latency layers (debug in this order)
Most people start debugging agent latency by looking at model benchmarks. "Maybe I need a faster LLM." That's like diagnosing a slow website by replacing the database when the real problem is unoptimized SQL queries hitting the database 47 times per page load.
Agent latency has five layers. They compound multiplicatively, not additively. A problem at layer 3 makes layer 4 worse, which makes layer 5 catastrophic.
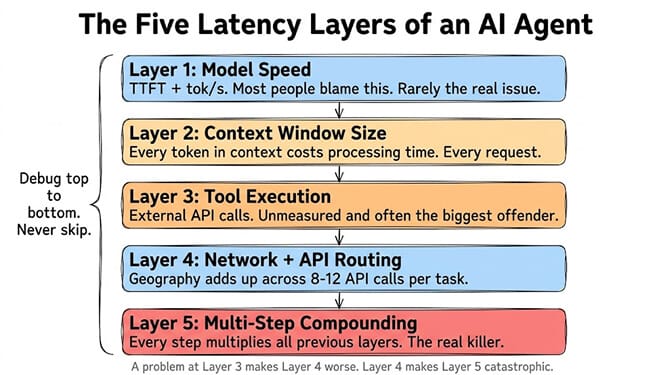
Layer 1: Model speed (the one everyone checks first)
Time to first token (TTFT) measures how long after you send a prompt the model starts generating. Per-token latency (tok/s) measures how fast it generates once it starts.
Here's where things stand in 2026:
Fastest TTFT: Claude Haiku 4.5 at around 597ms on medium prompts. Mistral Large and GPT-5.2 also hit sub-second consistently.
Fastest throughput: Gemini 2.5 Flash at 146-173 tokens per second. Mercury 2 by Inception hits 789 tok/s but with quality tradeoffs. Gemini 3.5 Flash reaches 284 tok/s.
Reasoning models are intentionally slow. Models like o3, GPT-5, and Gemini Deep Think use chain-of-thought processing. They generate internal "thinking" tokens before the visible answer. TTFT can be 10-150 seconds. This isn't a bug. It's the architecture.
Here's the thing: for most agent workloads, model speed is not your bottleneck. A single LLM call takes about 800 milliseconds. If your agent is taking 15 seconds, the model used 800ms of that. You have 14.2 seconds of latency living somewhere else.
Before switching models, measure your actual model latency. Log the timestamp when you send the request and when the first token arrives. If it's under 2 seconds, your problem isn't the model.
Layer 2: Context window bloat (the silent killer)
This is where most agent latency actually lives. And it's invisible unless you're counting tokens.
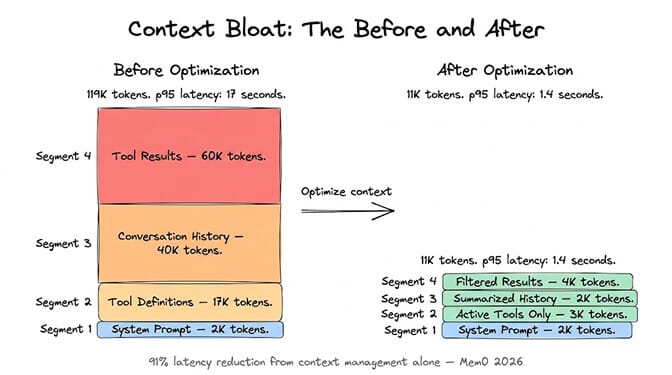
Every time your agent makes a request, it sends the entire conversation context to the model. System prompt. Conversation history. Tool definitions. Previous tool results. Memory context. All of it.
The numbers are wild. Research from Agenteer found that a single Jira integration adds roughly 17,000 tokens just for tool definitions. Across a typical agent setup with multiple integrations, 134,000 tokens (67% of a 200K context window) get consumed by definitions before the agent starts working.
That's the equivalent of walking into a restaurant and reading a 500-page menu before you can order water.
More tokens means more processing time. A 2,000-token prompt processes in under a second. A 100,000-token prompt with tool definitions, conversation history, and previous results takes significantly longer. The model has to read and attend to every token before generating a response.
Your context window is RAM, not storage. Everything in it costs processing time on every single request.
How to diagnose it
Log your input token count for each request. If it's growing with every turn of the conversation, you have context bloat. If it starts high (above 20,000 tokens) even on the first turn, your tool definitions and system prompts are too heavy.
How to fix it
Don't load all tool definitions upfront. Anthropic's own research showed that Opus 4's tool selection accuracy improved from 49% to 74% when the agent searched for relevant tools on demand instead of parsing all definitions at once. Fewer tools in context means faster processing and better accuracy.
Summarize conversation history. Instead of sending the full conversation, compress older turns into summaries. The Mem0 framework published 2026 benchmarks showing that a two-layer memory architecture (summarized context plus targeted retrieval) used 4x fewer tokens than full-context approaches while cutting latency by 91% and actually improving accuracy by 18.7 percentage points. This is the core of how AI agent memory works.
Trim tool results aggressively. A single MCP server call that returns a 50-field JSON blob when you only need 3 fields wastes thousands of tokens. Filter tool results before they enter context.
Layer 3: Tool execution (the one you forgot to measure)
When your agent calls an external tool (send email, read CRM, query database, fetch webpage), the tool's execution time adds directly to the agent's response time. And most people never measure it.
A Gmail API call to fetch recent emails: 200-800ms. A HubSpot CRM lookup: 300-1,200ms. A web scraping call: 1-5 seconds. A database query on an unindexed table: could be anything from 50ms to 30 seconds.
If your agent makes 3 tool calls in sequence (which is common for multi-step tasks), and each takes an average of 1 second, that's 3 seconds of tool execution time before the model even starts thinking about the next step.
How to diagnose it
Wrap every tool call with timing logs. You'll often find that one specific tool is responsible for 60-80% of total tool execution time.
How to fix it
Parallelize where possible. If your agent needs data from Gmail and HubSpot, fetch both simultaneously instead of sequentially. This cuts tool execution time in half for independent calls.
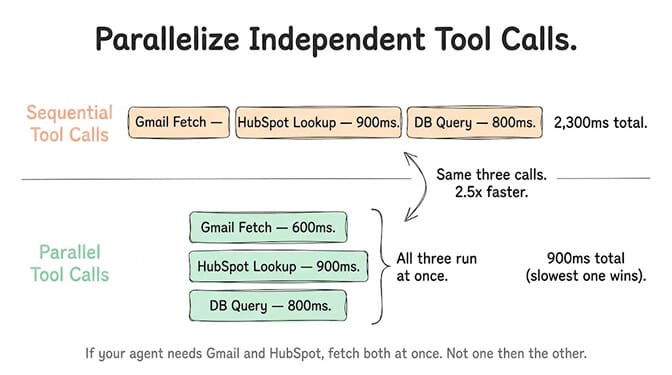
Cache repeated lookups. If your agent queries the same CRM record multiple times in one conversation, cache the first result. Semantic caching, as Redis LangCache demonstrated, can reduce redundant API calls dramatically.
Set timeouts. A tool call that takes 30 seconds because of an external API issue shouldn't freeze your entire agent. Set aggressive timeouts (3-5 seconds) and have fallback behavior.
This is one of the areas where managed agent platforms have an advantage over self-hosted setups. On BetterClaw, integrations are pre-optimized with connection pooling, caching, and timeout handling built in. When you self-host, you're building all of that yourself.
Layer 4: Network and API routing
If your agent is on a VPS in Frankfurt and your users are in San Francisco, every API round-trip adds 100-200ms of network latency. For a single request, that's barely noticeable. For an agent that makes 8-12 API calls per task (LLM calls plus tool calls plus memory lookups), it adds up to 1-2 seconds of pure network overhead.
How to diagnose it
Run ping to your LLM provider's API endpoint from your agent's server. If it's over 100ms, geography is costing you.
Compare agent response times from the same machine the agent runs on versus from your actual user location. The difference is network overhead.
How to fix it
Deploy your agent close to your LLM provider's data centers. Most major providers (OpenAI, Anthropic, Google) have US and EU endpoints. Match your agent's region to the provider's closest endpoint.
Use streaming. Instead of waiting for the full response, stream tokens to the user as they're generated. This doesn't reduce total latency, but it reduces perceived latency dramatically. The user sees the response building in real-time instead of staring at a loading spinner for 8 seconds.
Minimize round-trips. Every time your agent "thinks" (LLM call), "acts" (tool call), and "observes" (processes result), that's at minimum three network round-trips per step. Reducing the number of steps reduces total round-trip overhead proportionally.
Layer 5: Multi-step compounding (the multiplier nobody talks about)
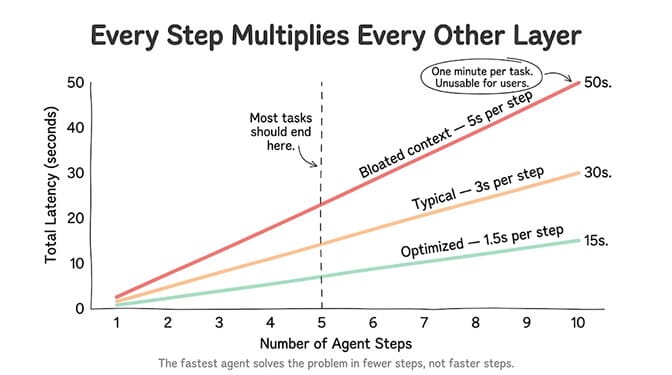
Here's where agent latency gets genuinely painful. Every additional step in your agent's workflow multiplies all the previous layers.
A single LLM call: ~800ms. Totally fine.
An orchestrator-worker flow with a reflexion loop: 10-30 seconds. Stevens Institute research puts this as the primary engineering constraint for AI agents in 2026.
A 10-step agent task means 10 LLM calls, potentially 10 tool calls, context growing with every turn, and network overhead on every round-trip. If each step takes 1.5 seconds (fast!), your total task time is 15 seconds. If each step takes 3 seconds (normal), you're at 30 seconds. At 5 seconds per step (common with context bloat), you're looking at nearly a minute.
For user-facing applications, an orchestrator-worker flow with reflection can take 10-30 seconds. For customer support, this latency is often unacceptable.
The honest math
Let's say your agent handles a support ticket. Steps: (1) read the ticket, (2) look up customer in CRM, (3) check order history, (4) check knowledge base, (5) draft response, (6) format and send.
Six steps. Each step involves at least one LLM call (800ms), one tool call (500ms average), and context processing that grows each turn. Conservative estimate: 2 seconds per step = 12 seconds total. Realistic with context bloat: 4 seconds per step = 24 seconds total.
This is why smart agent design keeps step count low. The fastest agent isn't the one with the fastest model. It's the one that solves the problem in 3 steps instead of 8.
The 60-second diagnostic checklist
When your agent is slow, run through this in order:
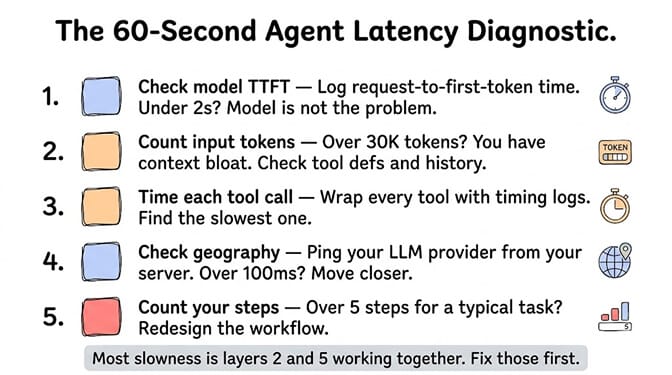
Check model TTFT. Log the time between request sent and first token received. If it's under 2 seconds, the model isn't your problem.
Count input tokens. If your input exceeds 30,000 tokens per request, you have context bloat. Check tool definitions, conversation history, and tool results.
Time each tool call. Find the slowest one. It's probably responsible for most of your tool execution latency.
Check geography. Ping your LLM provider from your agent's server. If it's over 100ms, move closer.
Count your steps. If your agent takes more than 5 steps for a typical task, redesign the workflow to reduce steps.
Most agent slowness is layers 2 and 5 working together. Bloated context makes each step slower. More steps means more bloated context. It's a feedback loop that gets worse with every conversation turn.
This is exactly why we built smart context management into BetterClaw from day one. Token bloat is the number one production agent killer, and most self-hosted frameworks leave you to solve it yourself. On BetterClaw, context is automatically managed per agent, tool results are filtered before entering the window, and persistent memory uses hybrid vector plus keyword retrieval so your agent doesn't drag around dead conversation weight. Free plan with 1 agent and 500 credits a month. $49/month for Pro. BYOK with zero inference markup.
When switching models actually helps (and when it doesn't)
After all that, there are specific cases where the model genuinely is the bottleneck:
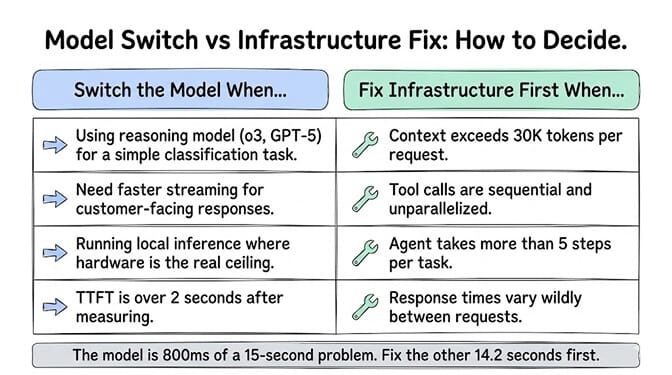
You're using a reasoning model for a classification task. If your agent is classifying email urgency (simple task) using o3 or GPT-5 (reasoning model), you're paying 10-30 seconds of "thinking" latency for a task that Haiku or Flash can handle in 600ms. Match model size to task complexity. The framework for choosing the right LLM per task covers this directly.
You need streaming for user-facing interactions. Some providers stream faster than others. Gemini 2.5 Flash at 173 tok/s finishes a 1,100-token response in under 7 seconds. Slower models might take 20+ seconds for the same output. For customer-facing agents, streaming speed matters.
Your agent runs on local hardware. If you're running local inference on a Mac Mini or mid-range GPU, the model is genuinely slow (3-5 seconds to first token, 30-40 tok/s). Cloud APIs are 5-10x faster for agent workloads. We break down the hardware speed gap in detail.
For everything else, fix layers 2-5 first. You'll get more speed improvement from trimming 50,000 tokens out of your context window than from switching to a model that's 200ms faster on TTFT.
The difference between a frustrating agent and a fast one usually isn't the model. It's whether someone bothered to measure where the latency actually lives.
If you'd rather skip the latency debugging entirely, give BetterClaw a look. Context management, tool optimization, caching, and infrastructure are all handled. Free plan with 1 agent and 500 credits a month. $49/month for Pro on Pro. Your agent deploys in 60 seconds. On infrastructure we've already optimized for speed.
Frequently Asked Questions
What causes AI agent latency?
AI agent latency comes from five layers: model speed (time to first token and generation rate), context window size (more tokens means more processing time per request), tool execution time (external API calls like CRM, email, or database lookups), network round-trips between your agent and API endpoints, and multi-step compounding where each workflow step multiplies all previous delays. In most cases, context bloat and step count cause more slowness than the model itself.
How does LLM latency differ between providers in 2026?
Claude Haiku 4.5 leads on time to first token at around 597ms. Gemini 2.5 Flash leads on throughput at 146-173 tokens per second. Reasoning models (o3, GPT-5, Gemini Deep Think) are intentionally slow, often 10-150 seconds to first token due to chain-of-thought processing. For agent workloads, the fastest practical choices are Gemini Flash variants for throughput and Claude Haiku for TTFT.
How do I reduce my AI agent's response time?
Start by logging input token counts. If they exceed 30,000 tokens, compress conversation history into summaries, load tool definitions on demand instead of all at once, and filter tool results before they enter context. Mem0's 2026 benchmarks showed that optimized context management cut latency by 91% while improving accuracy. After fixing context, parallelize independent tool calls and reduce total workflow steps.
Does switching to a faster LLM model fix agent latency?
Usually not. A single LLM call takes about 800ms. If your agent takes 15 seconds total, the model accounts for roughly 5% of the latency. The other 95% is context processing, tool execution, network overhead, and multi-step compounding. Switch models only when you're using a reasoning model for simple tasks, need faster streaming for user-facing responses, or running local inference where hardware is the genuine bottleneck.
Is managed hosting faster than self-hosted AI agents?
Generally yes, for three reasons: managed platforms pre-optimize tool integrations with connection pooling and caching, they handle context management automatically to prevent token bloat, and they deploy on infrastructure close to major LLM provider data centers. BetterClaw's managed infrastructure includes smart context management, optimized integrations, and zero setup overhead. Self-hosting gives you full control but requires you to solve every latency layer yourself.